
Would you like to schedule a demo or ask us a question? Please fill out the form below and we will get back to you as soon as possible.
Press release July 10th, 2026
Los Angeles, CA – July 9, 2026 – When FIFA launched its Fan Festival concept at the 2006 World Cup in Germany, the premise was simple: more people wanted to be part of the tournament than there were tickets available. Twenty years later, FIFA Fan Festivals have become a fixture of the tournament experience, drawing crowds that collectively rival stadium attendance across host cities.
FIFA World Cup 2026 is putting that reality to the test in American cities for the first time, and three weeks in, the data is already telling a story worth paying attention to. We’ve been tracking shared micromobility trips around fan festivals and watch parties across the group stage, in Los Angeles and San Jose. Across host cities, public transportation has moved hundreds of thousands of fans efficiently under genuinely complex conditions, a real achievement for the regions involved. But the story doesn’t end at the stadium gates. What we’re seeing offers a new lens on how cities absorb a tournament of this scale, and where the planning picture still has room to grow with the knockout rounds, the semifinals, and the final still ahead.
What the stadium shows in LA
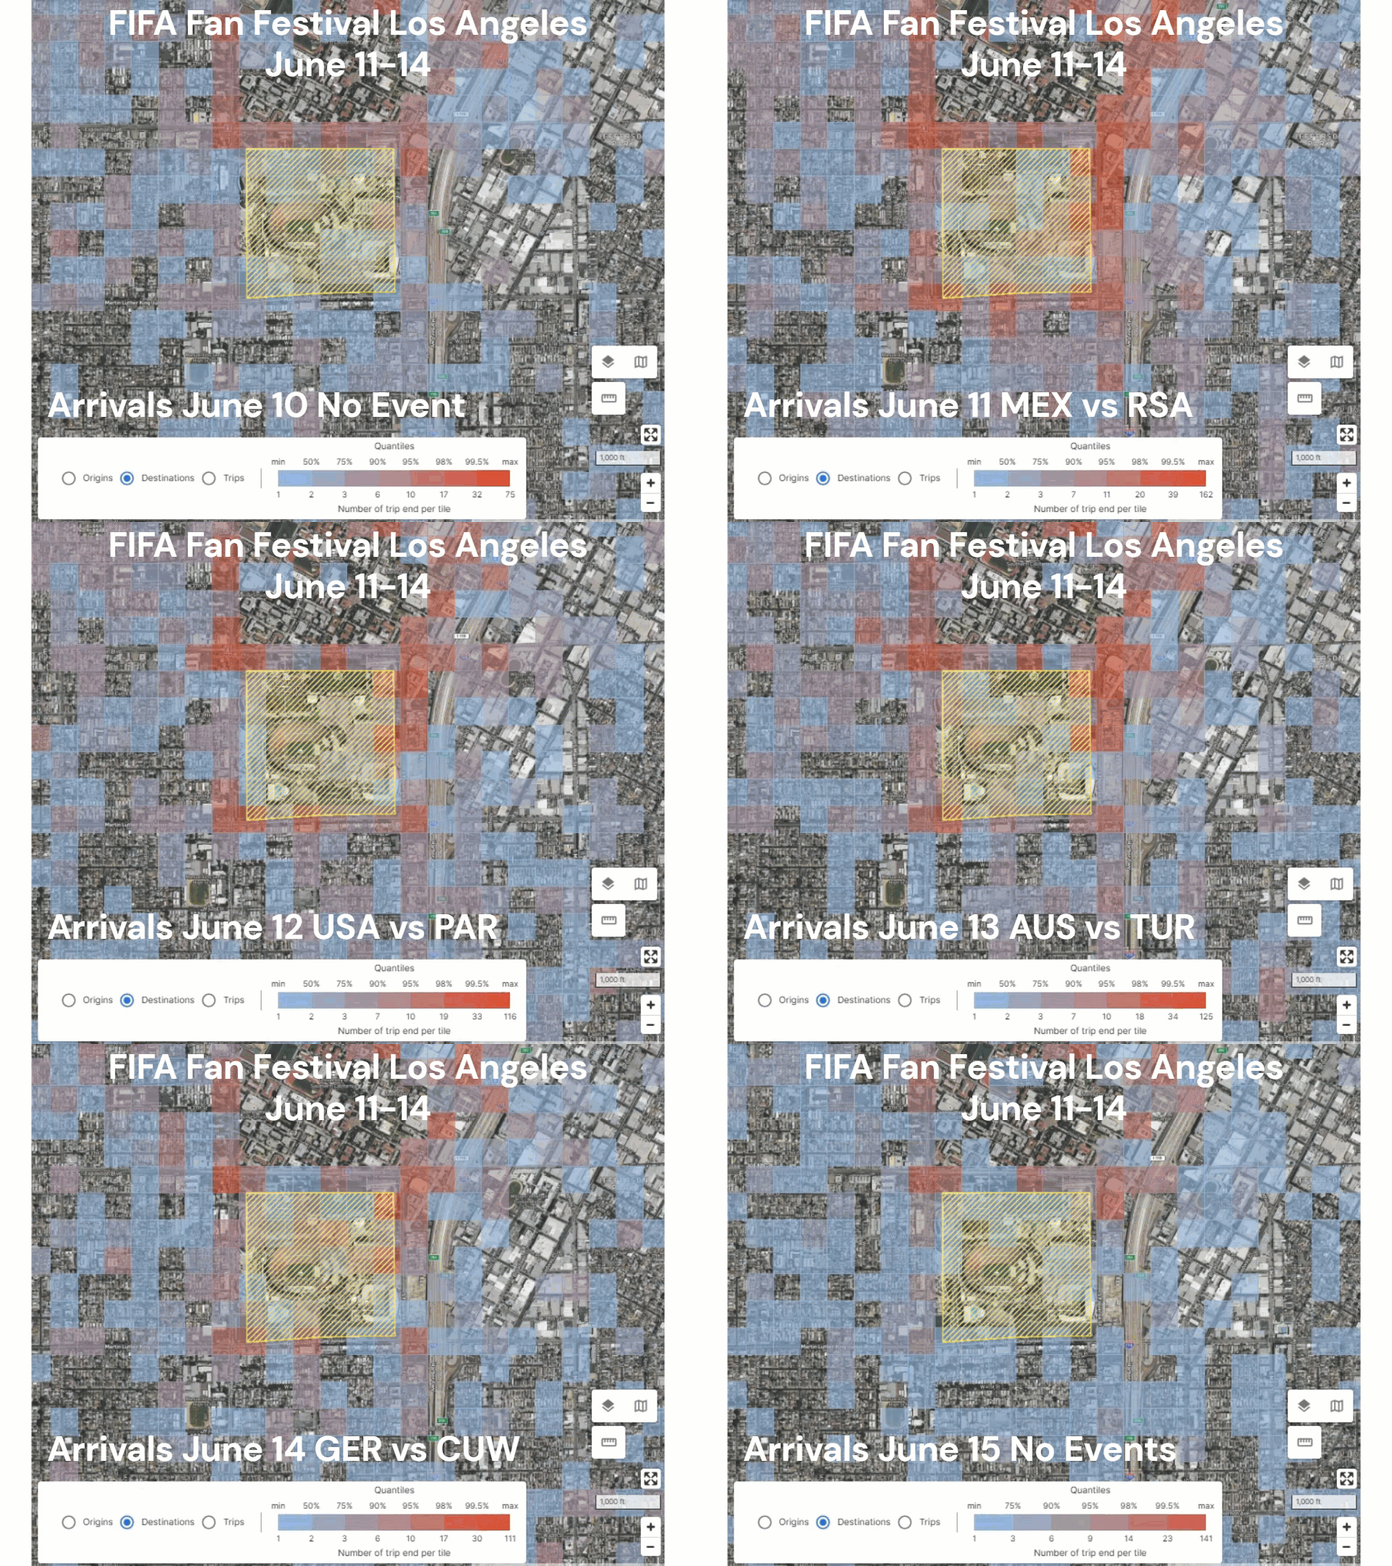
The FIFA Fan Festival at the LA Memorial Coliseum ran June 11-14. The yellow perimeter on our maps marks the event boundary: fans parked and walked in from there, across all modes. Our destination heat maps track where shared micromobility trips end, giving a ground-level picture of how people are actually arriving and dispersing.
On June 11, the first match day (Mexico vs. South Africa), the shared fleet around the Coliseum peaked at approximately 1,400 vehicles in the surrounding area, a roughly 40% increase over a typical day (e.g. June 10), and notable given this corridor already sees consistent micromobility activity serving the USC campus nearby.
The pattern held consistently across all four days, with activity spreading well beyond the venue boundary into surrounding residential blocks, which is a reminder that a fan zone’s real footprint and its permitted footprint are rarely the same thing.
(c) Blue Systems for LADOT
The blocks around the Coliseum absorbed foot traffic and scooter demand that extended well beyond the planned perimeter, showing data that could inform how similar events are planned and managed in the future.
When a neighborhood becomes the venue
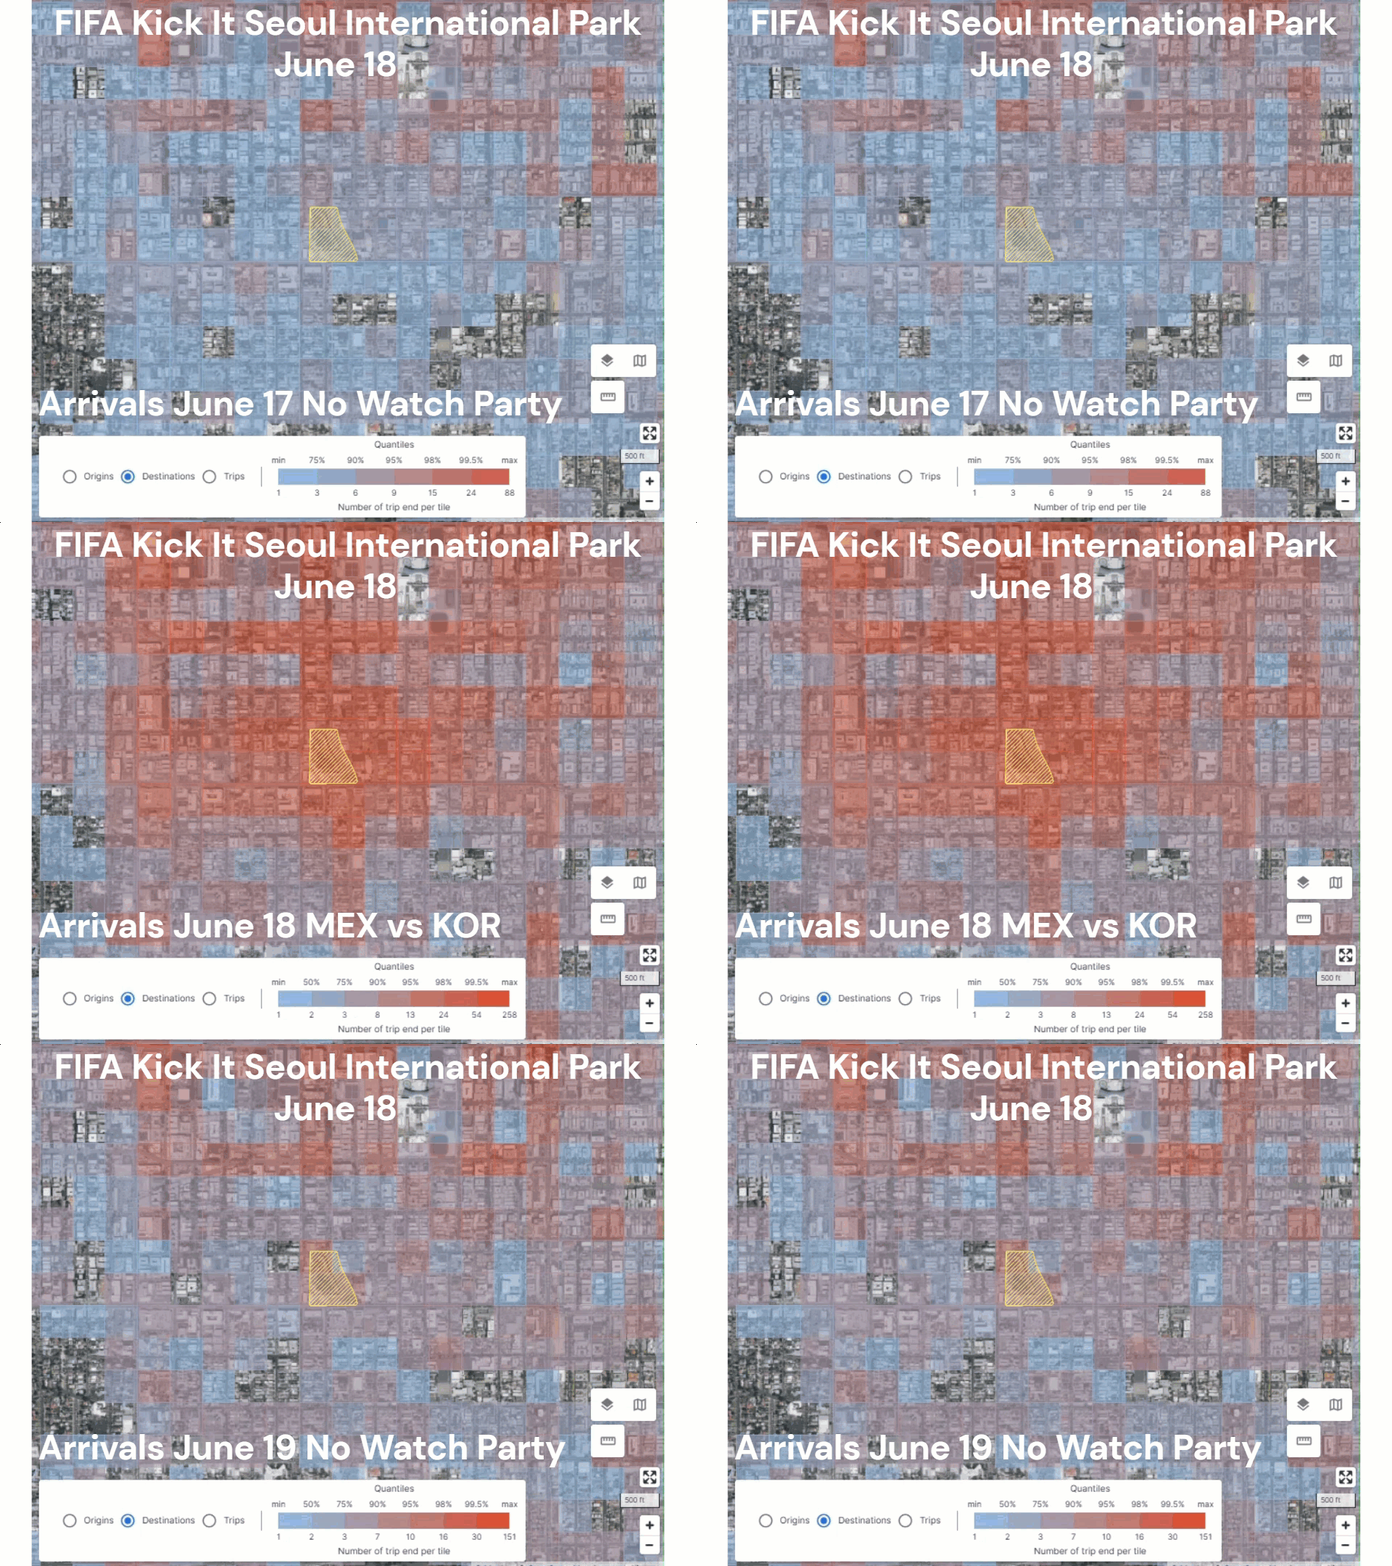
A few miles northeast, in Koreatown, the FIFA Kick It event at Seoul International Park on June 18 showed what happens when a fan zone outgrows itself entirely. The MEX vs. KOR match drew an enormous crowd to Seoul International Park, reflecting the deep fan communities both teams have in Los Angeles.
On a normal evening the day before (June 17), the area around Seoul International Park had roughly 400 scooters and bikes in circulation. By match time on June 18, that number had climbed to over 2,000 which represent a 5x increase, with 1,600 additional vehicles converging on the neighborhood. When the final whistle blew, approximately 1,200 of them departed within a short window, flooding the surrounding streets simultaneously.
Where vehicles concentrated, and how sharply the fleet turned over once the match ended, tells a story that’s directly useful for event planning, street management, and transit coordination next time around.
(c) Blue Systems for LADOT
San Jose, same dynamic
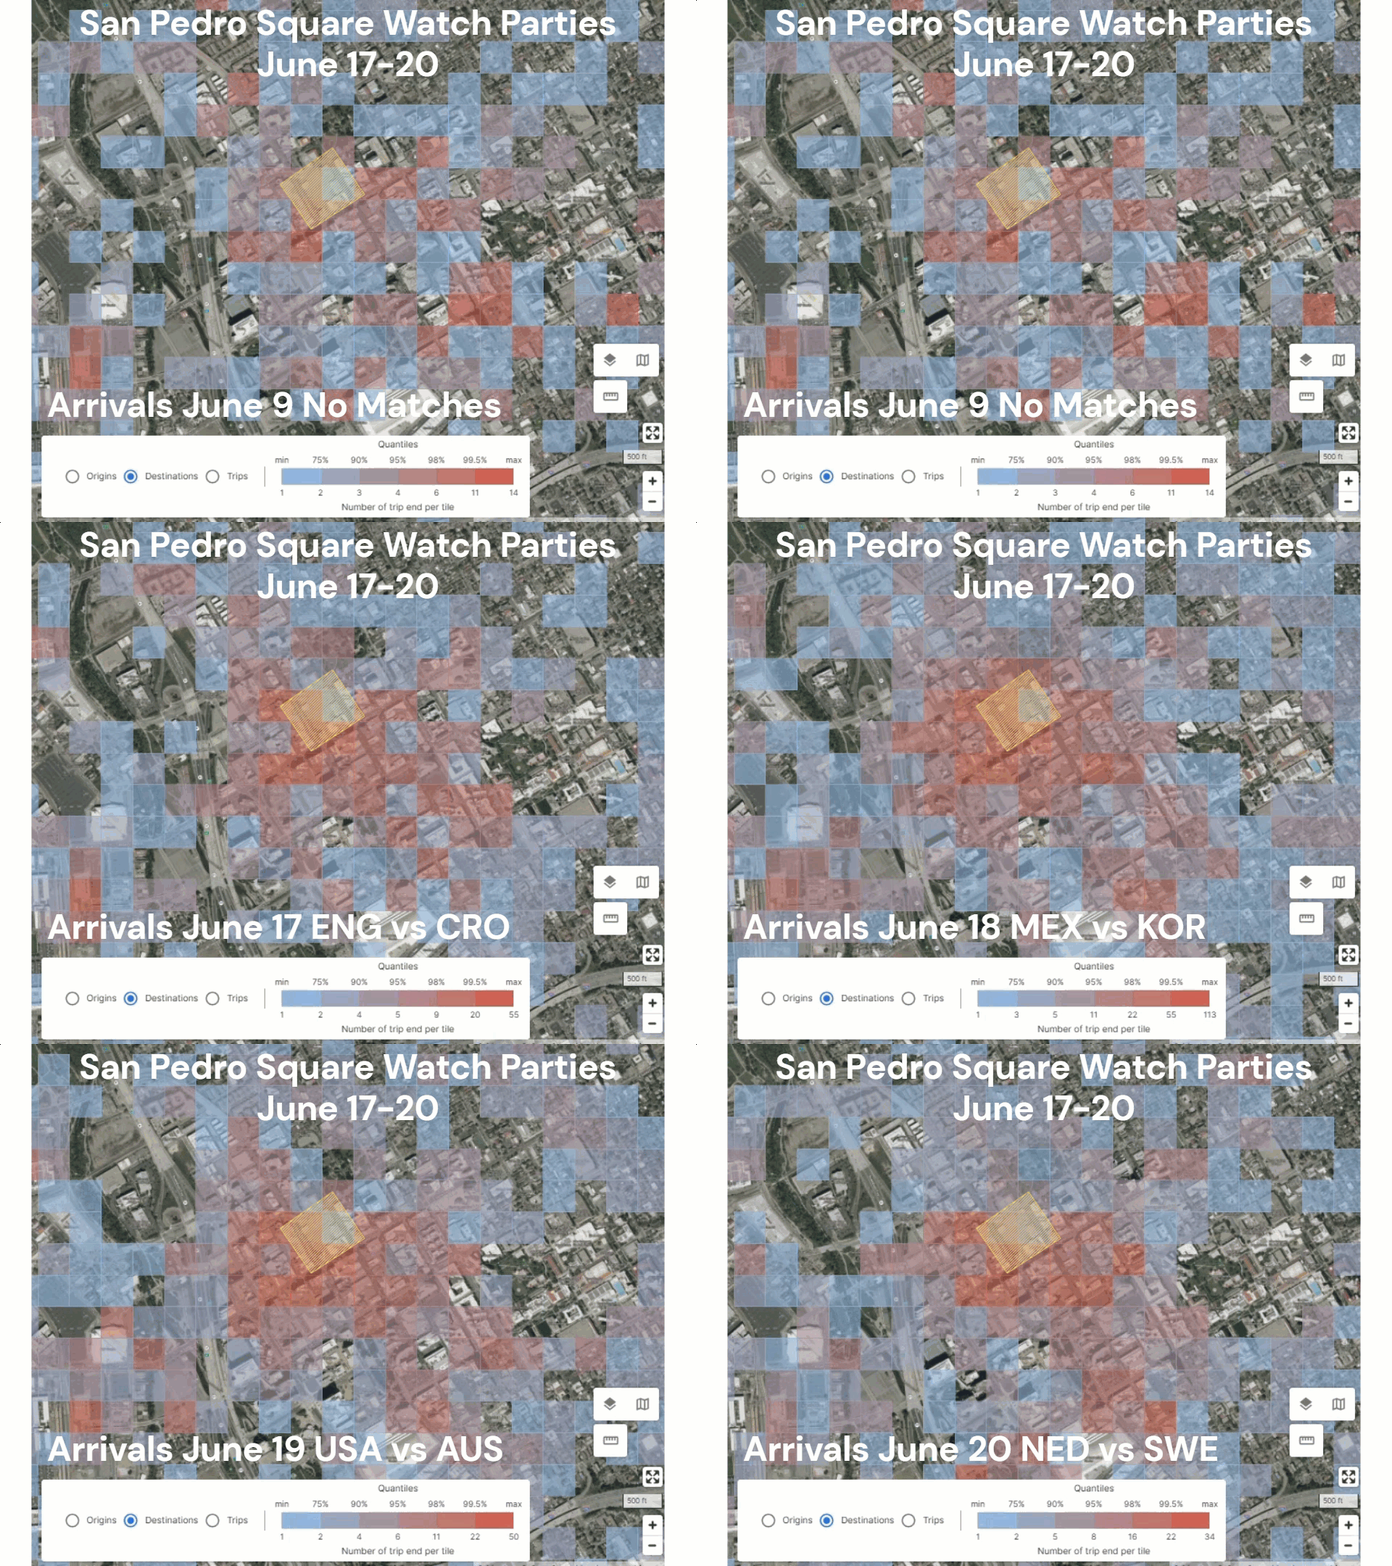
San Pedro Square became the Bay Area’s main World Cup gathering spot across the group stage, with watch parties drawing consistent crowds over June 17-20. The shared micromobility data followed the matches closely.
On a normal day with no matches, scooters and bikes were distributed across the city as expected, a small fraction of the fleet ending up within a few blocks of the square at any given time. On match days, that changed sharply. At peak, over 40% of San Jose’s entire shared scooter fleet was concentrated within a couple of blocks of San Pedro Square, up from just around 10% on non-match days in that area of downtown. The geographic footprint shifted depending on which fan communities were showing up, with some matches drawing demand from a wider surrounding area than others.
(c) Blue Systems for City of San Jose
Planning for the fans means planning for where they actually go
Practitioners across urban planning and the transportation industry have argued for years that fan zones deserve the same planning rigor as the venues themselves: that transport, safety, and street management around a fan zone should be treated as event infrastructure, not a peripheral concern. Shared micromobility data adds another layer to that argument.
A city that can see scooter and bike trip density building around a watch party has early signal. Signal that a particular block is absorbing far more people than expected, that the departure wave is about to hit, and that the real footprint has grown well beyond what was planned for.
FIFA 2026 has more matches to play with the quarters on the horizon. LA28 is two years out. The infrastructure investment these events require is enormous, and much of it rightly goes into stadiums, transit, and security. The data that already exists on the street – including shared mobility data – adds another layer to how cities can understand and plan for the full event footprint, including the parts that weren’t on the original map.
Blue Systems works with cities like Los Angeles and San Jose, and transit agencies across North America and beyond to make that data visible and actionable. As the knockout rounds unfold and LA28 planning gets underway, that feels like a layer worth building in from the start.